First and Last Frost Dates for 129 US Cities (NOAA Data)

By Efraín Vega · Published October 6, 2026
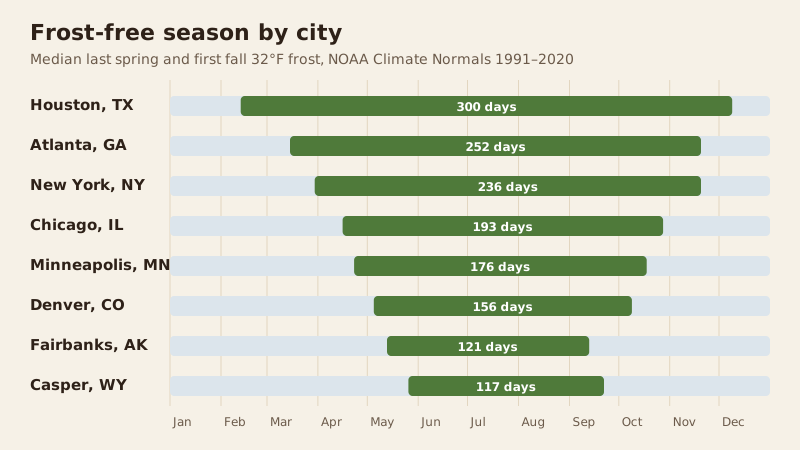
Average last spring frost dates in the US range from January in the warmest parts of California, Texas and Louisiana to late May or early June in the mountain West, and first fall frosts run from mid-September to late December. We pulled NOAA's official 1991–2020 freeze statistics for 129 cities in all 50 states: the median city gets about 200 frost-free days a year.
Find your city in the table below, then plant tender crops after its 90% safe date, not the average.
How do you read a frost date?
NOAA gives each freeze date with a probability, based on 30 years of daily low temperatures (1991–2020). We show two for each season:
- Last spring frost (50%): the median date. In half of years, the last 32°F freeze comes later than this. It's the number most planting calendars call the "average last frost."
- 90% safe after: only a 10% chance of a freeze after this date. Use it for tender transplants like tomatoes, peppers, basil and squash.
- First fall frost (50%): in half of years, the first freeze comes earlier than this.
- 90% frost-free until: only a 10% chance of a freeze before this date. Plan fall harvests of tender crops to finish by then.
Across the 121 cities with a regular frost season, the 90% spring date falls 17 days after the median on average (from 10 days in Anchorage to 33 days in San Jose). In fall, the safe date comes about 15 days before the median.
Frost dates for 129 US cities
| City | Last spring frost | 90% safe after | First fall frost | 90% frost-free until | Frost-free days |
|---|---|---|---|---|---|
| Birmingham, AL | Mar 21 | Apr 8 | Nov 11 | Oct 30 | 236 |
| Huntsville, AL | Mar 24 | Apr 8 | Nov 8 | Oct 27 | 229 |
| Mobile, AL | Mar 3 | Mar 21 | Nov 25 | Nov 8 | 268 |
| Montgomery, AL | Mar 13 | Mar 31 | Nov 13 | Oct 31 | 244 |
| Anchorage, AK | May 5 | May 15 | Oct 1 | Sep 18 | 147 |
| Fairbanks, AK | May 13 | May 26 | Sep 13 | Aug 29 | 121 |
| Juneau, AK | May 4 | May 18 | Oct 3 | Sep 18 | 150 |
| Flagstaff, AZ | Jun 4 | Jun 19 | Sep 28 | Sep 16 | 115 |
| Phoenix, AZ* | Jan 5 | Jan 22 | Jan 3 | Dec 18 | 365 |
| Tucson, AZ | Feb 5 | Mar 2 | Dec 9 | Nov 21 | 307 |
| Little Rock, AR | Mar 21 | Apr 6 | Nov 10 | Oct 29 | 234 |
| Bakersfield, CA | Jan 17 | Feb 18 | Dec 15 | Nov 30 | 334 |
| Fresno, CA | Jan 14 | Feb 11 | Dec 14 | Nov 29 | 337 |
| Los Angeles, CA | Rare | Rare | Rare | Rare | 365 |
| Sacramento, CA | Feb 2 | Mar 5 | Dec 2 | Nov 16 | 301 |
| San Diego, CA | Rare | Rare | Rare | Rare | 365 |
| San Francisco, CA | Rare | Rare | Rare | Rare | 365 |
| San Jose, CA | Jan 12 | Feb 14 | Dec 22 | Dec 1 | 347 |
| Colorado Springs, CO | May 3 | May 15 | Oct 8 | Sep 26 | 158 |
| Denver, CO | May 5 | May 19 | Oct 9 | Sep 27 | 156 |
| Grand Junction, CO | Apr 28 | May 14 | Oct 16 | Oct 3 | 171 |
| Bridgeport, CT | Apr 5 | Apr 17 | Nov 6 | Oct 25 | 216 |
| Hartford, CT | Apr 21 | May 6 | Oct 16 | Oct 3 | 177 |
| Wilmington, DE | Apr 7 | Apr 21 | Nov 1 | Oct 19 | 209 |
| Washington, DC | Mar 24 | Apr 6 | Nov 18 | Nov 5 | 241 |
| Jacksonville, FL | Feb 25 | Mar 19 | Dec 7 | Nov 17 | 288 |
| Miami, FL | Rare | Rare | Rare | Rare | 365 |
| Orlando, FL* | Jan 25 | Feb 26 | Jan 10 | Dec 18 | 355 |
| Tallahassee, FL | Mar 11 | Mar 30 | Nov 21 | Nov 3 | 255 |
| Tampa, FL* | Jan 20 | Feb 10 | Jan 12 | Dec 23 | 365 |
| Atlanta, GA | Mar 15 | Apr 4 | Nov 20 | Nov 4 | 252 |
| Macon, GA | Mar 21 | Apr 7 | Nov 10 | Oct 29 | 235 |
| Savannah, GA | Mar 2 | Mar 25 | Nov 30 | Nov 11 | 270 |
| Honolulu, HI | Rare | Rare | Rare | Rare | 365 |
| Boise, ID | Apr 24 | May 9 | Oct 21 | Oct 5 | 179 |
| Chicago, IL | Apr 16 | May 1 | Oct 28 | Oct 15 | 193 |
| Peoria, IL | Apr 16 | May 4 | Oct 23 | Oct 9 | 189 |
| Springfield, IL | Apr 14 | Apr 29 | Oct 20 | Oct 5 | 187 |
| Evansville, IN | Apr 4 | Apr 19 | Oct 29 | Oct 17 | 206 |
| Fort Wayne, IN | Apr 24 | May 10 | Oct 21 | Oct 8 | 178 |
| Indianapolis, IN | Apr 15 | May 2 | Oct 26 | Oct 13 | 193 |
| Des Moines, IA | Apr 18 | May 2 | Oct 20 | Oct 4 | 184 |
| Topeka, KS | Apr 12 | Apr 27 | Oct 23 | Oct 8 | 191 |
| Wichita, KS | Apr 11 | Apr 26 | Oct 29 | Oct 15 | 199 |
| Lexington, KY | Apr 13 | May 1 | Oct 28 | Oct 16 | 196 |
| Louisville, KY | Mar 31 | Apr 16 | Nov 7 | Oct 28 | 222 |
| Baton Rouge, LA | Feb 25 | Mar 19 | Nov 26 | Nov 7 | 276 |
| New Orleans, LA | Jan 30 | Feb 27 | Dec 31 | Dec 1 | 333 |
| Shreveport, LA | Mar 9 | Mar 29 | Nov 18 | Nov 2 | 255 |
| Portland, ME | Apr 26 | May 7 | Oct 15 | Oct 2 | 170 |
| Baltimore, MD | Apr 10 | Apr 25 | Oct 31 | Oct 17 | 204 |
| Boston, MA | Apr 4 | Apr 17 | Nov 9 | Oct 29 | 218 |
| Worcester, MA | Apr 23 | May 5 | Oct 21 | Oct 6 | 181 |
| Detroit, MI | Apr 20 | May 8 | Oct 27 | Oct 14 | 188 |
| Grand Rapids, MI | Apr 29 | May 15 | Oct 20 | Oct 4 | 174 |
| Lansing, MI | May 1 | May 18 | Oct 13 | Sep 29 | 162 |
| Duluth, MN | May 13 | May 29 | Oct 1 | Sep 18 | 140 |
| Minneapolis, MN | Apr 23 | May 7 | Oct 18 | Oct 1 | 176 |
| Jackson, MS | Mar 14 | Apr 2 | Nov 14 | Oct 31 | 245 |
| Kansas City, MO | Apr 13 | Apr 29 | Oct 24 | Oct 9 | 193 |
| Springfield, MO | Apr 9 | Apr 27 | Oct 27 | Oct 14 | 199 |
| St. Louis, MO | Apr 2 | Apr 17 | Nov 4 | Oct 23 | 215 |
| Billings, MT | May 4 | May 18 | Oct 7 | Sep 26 | 156 |
| Great Falls, MT | May 19 | Jun 2 | Sep 24 | Sep 9 | 126 |
| Missoula, MT | May 16 | Jun 1 | Sep 26 | Sep 12 | 130 |
| Lincoln, NE | Apr 24 | May 7 | Oct 13 | Sep 29 | 171 |
| Omaha, NE | Apr 18 | Apr 30 | Oct 21 | Oct 6 | 185 |
| Las Vegas, NV | Jan 20 | Feb 14 | Dec 15 | Nov 28 | 333 |
| Reno, NV | Apr 20 | May 5 | Oct 23 | Oct 11 | 184 |
| Concord, NH | May 8 | May 22 | Oct 3 | Sep 21 | 146 |
| Atlantic City, NJ | Apr 18 | May 5 | Oct 29 | Oct 13 | 190 |
| Newark, NJ | Apr 2 | Apr 15 | Nov 10 | Oct 28 | 222 |
| Albuquerque, NM | Apr 6 | Apr 23 | Nov 3 | Oct 21 | 208 |
| Albany, NY | Apr 27 | May 11 | Oct 15 | Oct 3 | 169 |
| Buffalo, NY | Apr 24 | May 9 | Oct 26 | Oct 10 | 183 |
| New York, NY | Mar 30 | Apr 9 | Nov 20 | Nov 6 | 236 |
| Rochester, NY | Apr 24 | May 8 | Oct 25 | Oct 8 | 181 |
| Syracuse, NY | Apr 29 | May 13 | Oct 19 | Oct 2 | 173 |
| Asheville, NC | Apr 9 | Apr 27 | Oct 28 | Oct 14 | 201 |
| Charlotte, NC | Mar 30 | Apr 14 | Nov 3 | Oct 22 | 221 |
| Greensboro, NC | Mar 30 | Apr 14 | Nov 5 | Oct 25 | 220 |
| Raleigh, NC | Mar 31 | Apr 16 | Nov 4 | Oct 23 | 219 |
| Bismarck, ND | May 14 | May 27 | Sep 27 | Sep 15 | 136 |
| Fargo, ND | May 10 | May 23 | Sep 30 | Sep 18 | 143 |
| Cincinnati, OH | Apr 18 | May 7 | Oct 25 | Oct 12 | 188 |
| Cleveland, OH | Apr 20 | May 5 | Nov 3 | Oct 21 | 198 |
| Columbus, OH | Apr 18 | May 5 | Oct 27 | Oct 14 | 191 |
| Dayton, OH | Apr 16 | May 3 | Oct 28 | Oct 16 | 194 |
| Toledo, OH | Apr 22 | May 7 | Oct 24 | Oct 11 | 188 |
| Oklahoma City, OK | Apr 4 | Apr 20 | Nov 2 | Oct 21 | 213 |
| Tulsa, OK | Mar 31 | Apr 15 | Nov 4 | Oct 20 | 220 |
| Eugene, OR | Apr 11 | May 9 | Oct 23 | Oct 6 | 196 |
| Medford, OR | Apr 8 | Apr 30 | Oct 29 | Oct 14 | 204 |
| Portland, OR | Mar 13 | Apr 1 | Nov 19 | Oct 29 | 247 |
| Harrisburg, PA | Apr 9 | Apr 25 | Nov 2 | Oct 18 | 206 |
| Philadelphia, PA | Apr 2 | Apr 13 | Nov 10 | Oct 30 | 224 |
| Pittsburgh, PA | Apr 23 | May 12 | Oct 23 | Oct 9 | 181 |
| Providence, RI | Apr 11 | Apr 23 | Oct 30 | Oct 16 | 199 |
| Charleston, SC | Mar 7 | Mar 27 | Nov 27 | Nov 8 | 266 |
| Columbia, SC | Mar 25 | Apr 10 | Nov 7 | Oct 26 | 229 |
| Greenville, SC | Mar 28 | Apr 14 | Nov 7 | Oct 26 | 224 |
| Rapid City, SD | May 12 | May 26 | Oct 1 | Sep 16 | 139 |
| Sioux Falls, SD | May 1 | May 14 | Oct 6 | Sep 23 | 157 |
| Chattanooga, TN | Mar 24 | Apr 8 | Nov 9 | Oct 27 | 230 |
| Knoxville, TN | Apr 1 | Apr 17 | Nov 2 | Oct 21 | 215 |
| Memphis, TN | Mar 16 | Apr 4 | Nov 16 | Nov 2 | 244 |
| Nashville, TN | Mar 31 | Apr 16 | Nov 3 | Oct 22 | 217 |
| Amarillo, TX | Apr 13 | Apr 29 | Oct 27 | Oct 14 | 195 |
| Austin, TX | Feb 20 | Mar 14 | Dec 3 | Nov 15 | 291 |
| Corpus Christi, TX | Jan 28 | Feb 28 | Dec 21 | Nov 25 | 331 |
| Dallas, TX | Mar 8 | Mar 26 | Nov 24 | Nov 6 | 262 |
| El Paso, TX | Mar 2 | Mar 19 | Nov 20 | Nov 6 | 261 |
| Houston, TX | Feb 13 | Mar 12 | Dec 9 | Nov 17 | 300 |
| Lubbock, TX | Apr 4 | Apr 22 | Nov 2 | Oct 19 | 210 |
| San Antonio, TX | Feb 26 | Mar 17 | Nov 28 | Nov 7 | 277 |
| Salt Lake City, UT | Apr 8 | Apr 30 | Oct 31 | Oct 17 | 204 |
| Burlington, VT | Apr 29 | May 11 | Oct 15 | Oct 2 | 169 |
| Norfolk, VA | Mar 17 | Mar 31 | Nov 23 | Nov 8 | 252 |
| Richmond, VA | Apr 3 | Apr 18 | Nov 4 | Oct 23 | 215 |
| Roanoke, VA | Apr 3 | Apr 18 | Nov 1 | Oct 18 | 210 |
| Seattle, WA | Mar 2 | Mar 23 | Nov 23 | Nov 6 | 266 |
| Spokane, WA | Apr 26 | May 10 | Oct 12 | Sep 29 | 168 |
| Yakima, WA | May 8 | May 27 | Oct 4 | Sep 23 | 149 |
| Charleston, WV | Apr 16 | May 5 | Oct 26 | Oct 13 | 192 |
| Green Bay, WI | Apr 30 | May 16 | Oct 9 | Sep 24 | 161 |
| Madison, WI | May 1 | May 16 | Oct 10 | Sep 26 | 160 |
| Milwaukee, WI | Apr 19 | May 2 | Oct 29 | Oct 15 | 192 |
| Casper, WY | May 26 | Jun 10 | Sep 22 | Sep 5 | 117 |
| Cheyenne, WY | May 12 | May 26 | Oct 1 | Sep 18 | 141 |
Want the raw numbers? Download the CSV, which includes each city's NOAA station ID and name.
Which cities have the shortest growing season?
Measured from the median last spring frost to the median first fall frost, the shortest frost-free seasons in our list are in the mountain West, the northern Plains and Alaska. Flagstaff's season is 115 days, less than four months.
| City | Last spring frost | First fall frost | Frost-free days |
|---|---|---|---|
| Flagstaff, AZ | Jun 4 | Sep 28 | 115 |
| Casper, WY | May 26 | Sep 22 | 117 |
| Fairbanks, AK | May 13 | Sep 13 | 121 |
| Great Falls, MT | May 19 | Sep 24 | 126 |
| Missoula, MT | May 16 | Sep 26 | 130 |
| Bismarck, ND | May 14 | Sep 27 | 136 |
| Rapid City, SD | May 12 | Oct 1 | 139 |
| Duluth, MN | May 13 | Oct 1 | 140 |
| Cheyenne, WY | May 12 | Oct 1 | 141 |
| Fargo, ND | May 10 | Sep 30 | 143 |
In these places, check days to maturity before you buy seeds. A 75-day tomato set out in early June has little room to spare, so many gardeners start seeds indoors and choose short-season varieties.
Which cities have the longest growing season?
Among cities that freeze in most winters, California's Central Valley, the Gulf Coast and the desert Southwest have the longest frost-free seasons: up to 347 days in San Jose.
| City | Last spring frost | First fall frost | Frost-free days |
|---|---|---|---|
| San Jose, CA | Jan 12 | Dec 22 | 347 |
| Fresno, CA | Jan 14 | Dec 14 | 337 |
| Bakersfield, CA | Jan 17 | Dec 15 | 334 |
| Las Vegas, NV | Jan 20 | Dec 15 | 333 |
| New Orleans, LA | Jan 30 | Dec 31 | 333 |
| Corpus Christi, TX | Jan 28 | Dec 21 | 331 |
| Tucson, AZ | Feb 5 | Dec 9 | 307 |
| Sacramento, CA | Feb 2 | Dec 2 | 301 |
| Houston, TX | Feb 13 | Dec 9 | 300 |
| Austin, TX | Feb 20 | Dec 3 | 291 |
Phoenix, Tampa and Orlando get freezes so briefly, and not every winter, that their median dates land around the new year. Five cities in our list (Los Angeles, San Diego, San Francisco, Miami and Honolulu) don't see a 32°F freeze in most years at all. In those places, frost isn't what limits the planting calendar; heat, rainfall or cool summers usually are.
Is your garden colder than the airport?
Probably, at least on some nights. Most of these stations are at airports or in city centers, which tend to stay warmer than open countryside. Your own yard can differ from the official date by a week or more:
- Low spots and valleys collect cold air on clear, calm nights.
- Higher elevation is colder. Flagstaff, at about 7,000 ft, has a shorter season than Fairbanks, Alaska.
- Frost can form on plants when the official temperature, measured about 5 ft up, is a few degrees above freezing.
- South-facing walls, paving and nearby water keep some spots warmer.
If a cold night is forecast after you've planted, cover tender plants. Our guide to protecting plants from frost covers row covers, cloches and low tunnels, and a cold frame adds weeks on both ends of the season.
How we built this table
- Source: NOAA National Centers for Environmental Information (NCEI), U.S. Climate Normals 1991–2020, annual/seasonal normals by station.
- Threshold: 32°F (a light freeze). NOAA also publishes 28°F "hard freeze" dates, which come later in fall and earlier in spring; they're not included here.
- Stations: for each city we used its main National Weather Service station, usually the primary airport (for New York, Central Park; for Washington, D.C., Reagan National). Station IDs are in the CSV.
- Frost-free days is NOAA's median growing-season length for the 32°F threshold.
- Data retrieved October 5, 2026. Climate normals are updated every 10 years; the 1991–2020 set is the current one.
Use this data
You're free to use the table, chart and CSV in your own articles, apps or planting guides. NOAA's data is public domain; we compiled and checked it. If it helps your readers, please credit Plot & Plank with a link to this page.
FAQ
What is a frost date?
It's the date of the last 32°F freeze in spring or the first in fall, worked out from decades of weather records. The dates on this page are NOAA's 1991–2020 climate normals: the median date, when a later spring freeze (or earlier fall freeze) is a 50/50 chance.
Should I plant on the average last frost date?
Not tender crops. On the median date there's still a 50% chance of another freeze. Wait for the 90% date before setting out tomatoes, peppers, basil or squash. In our 129 cities it comes about 17 days after the median date on average.
Why does my yard get frost when the forecast says 34°F?
Official temperatures are measured about 5 ft off the ground, often at airports that sit in warmer, built-up areas. On clear, calm nights, cold air settles in low spots and plants near the ground can frost even when the thermometer reads a few degrees above freezing.
Where does this data come from?
NOAA's National Centers for Environmental Information (NCEI), U.S. Climate Normals 1991–2020, annual/seasonal freeze statistics for a 32°F threshold. Each city uses its main National Weather Service station, listed in the CSV with its NOAA station ID.
Can I use this table on my site?
Yes. NOAA's data is public domain, and you're welcome to use our compiled table and CSV. If you do, please credit Plot & Plank with a link to this page.